Human-relevant 3D Cell-based Assay Platform
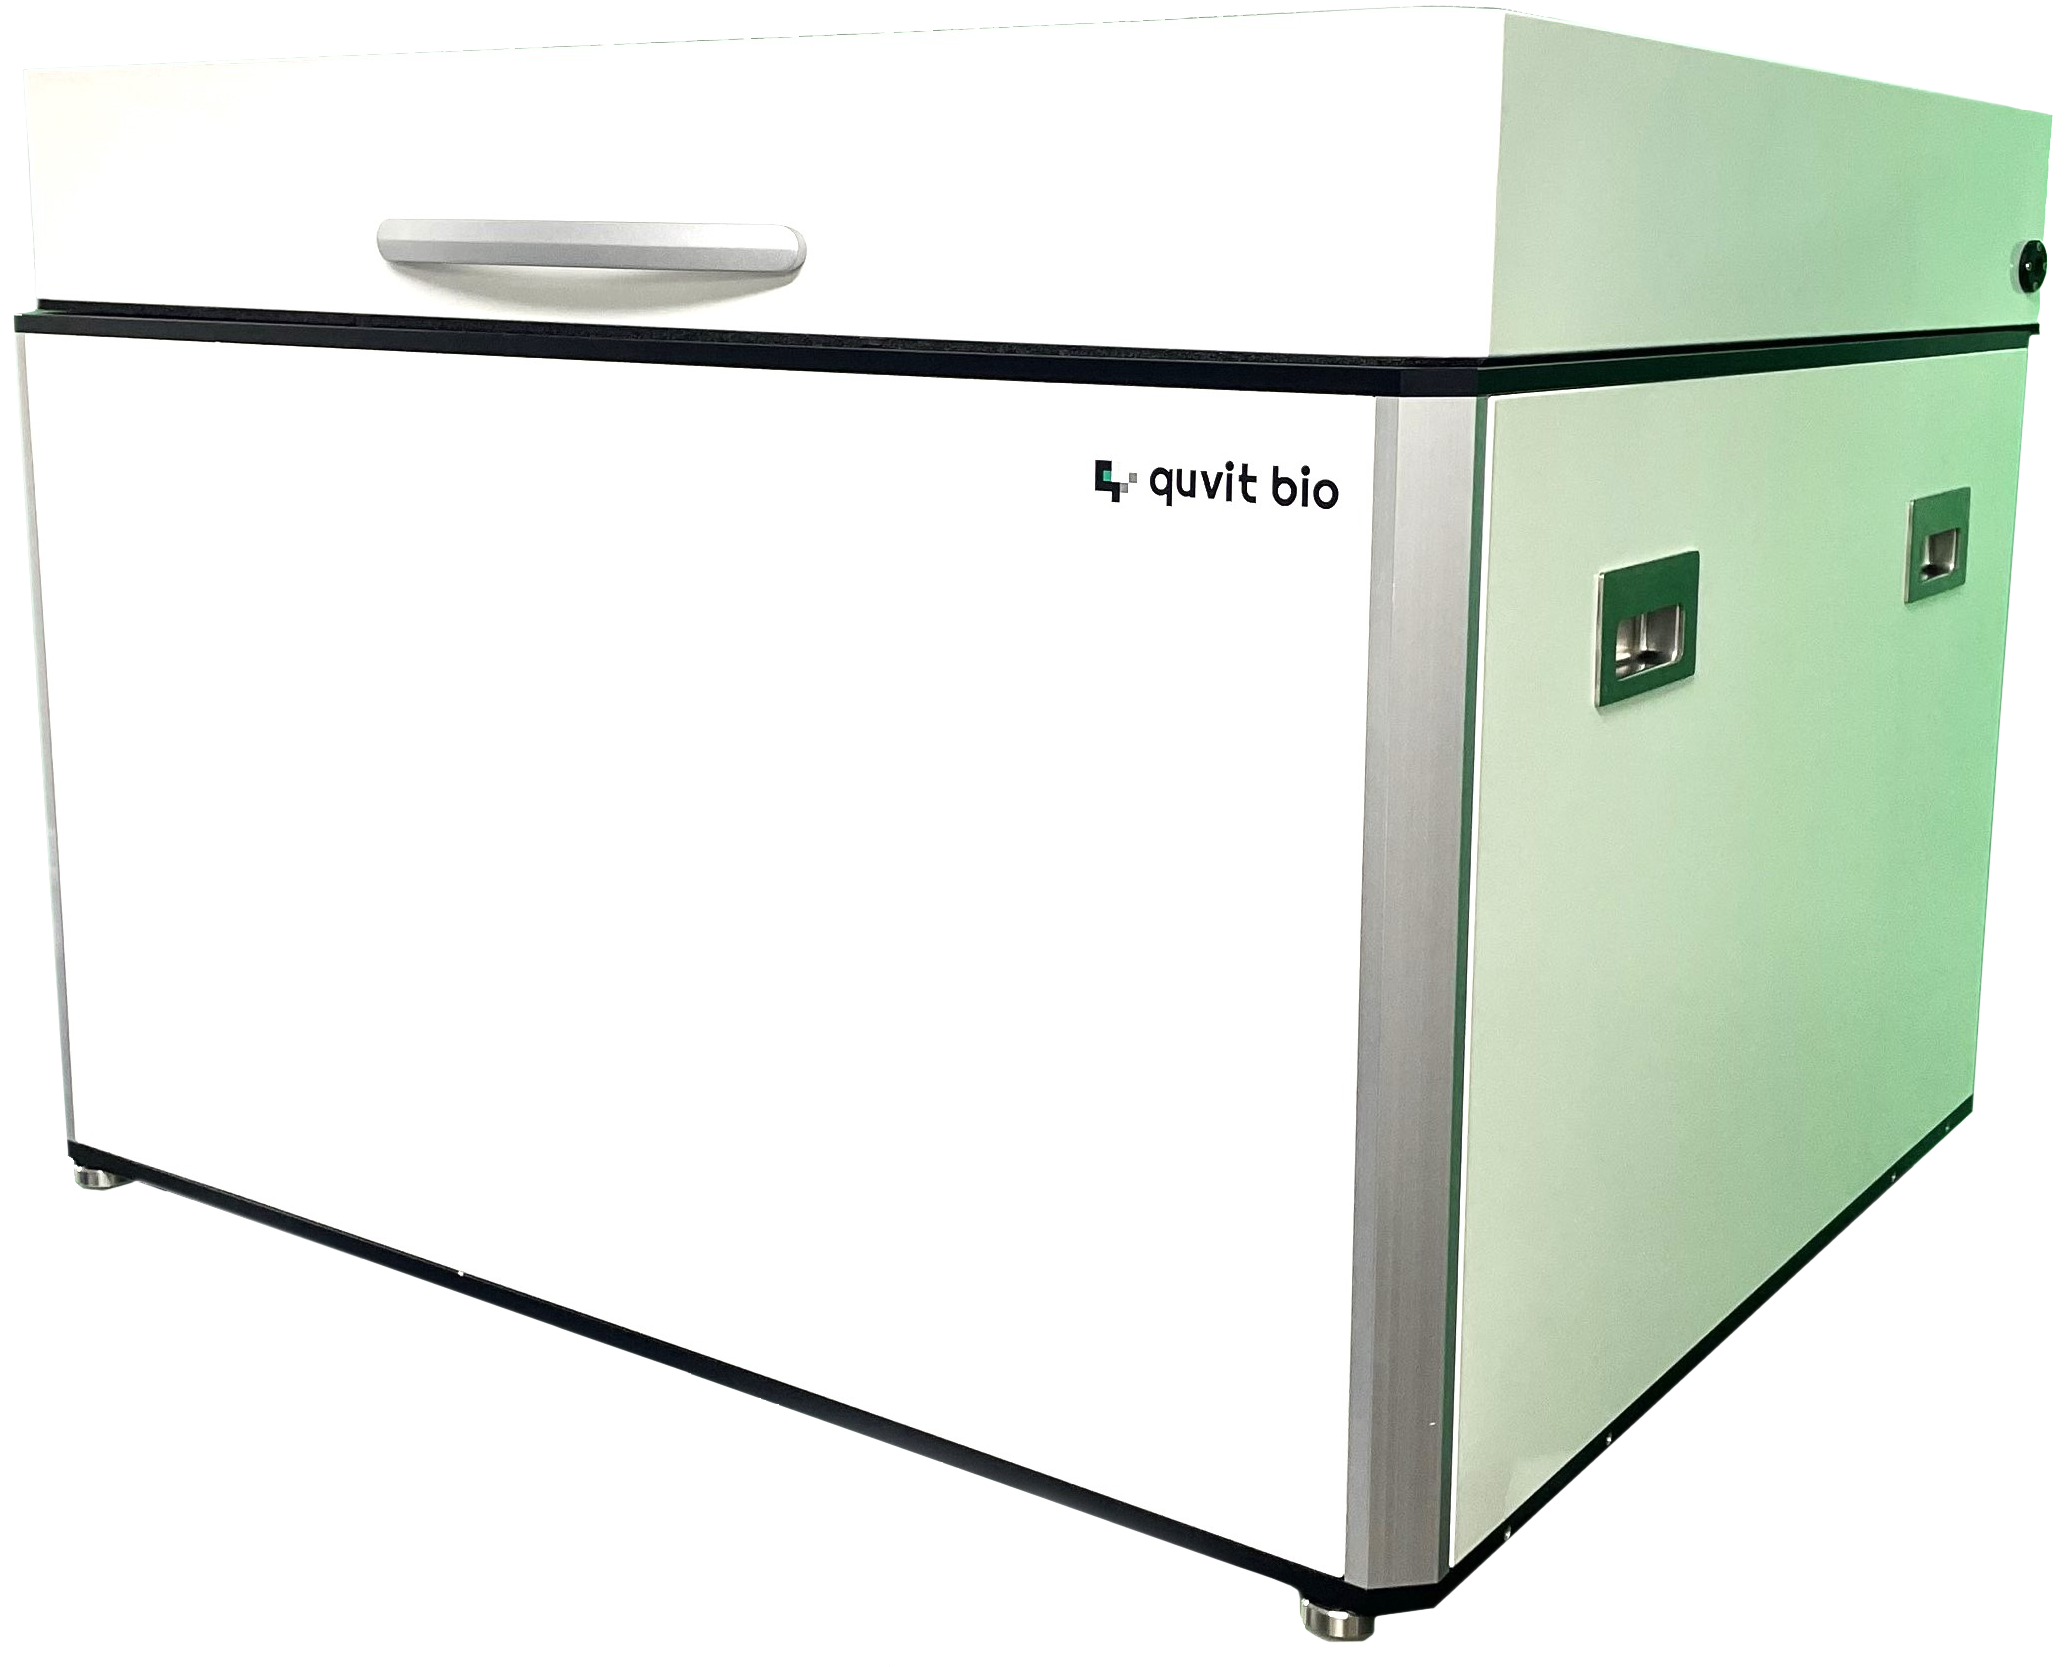
QField™ : Single-shot Volumetric Imaging-based 3D Fluorescence Analysis System
For customized trial, please contact us
Contact to the team
Application —
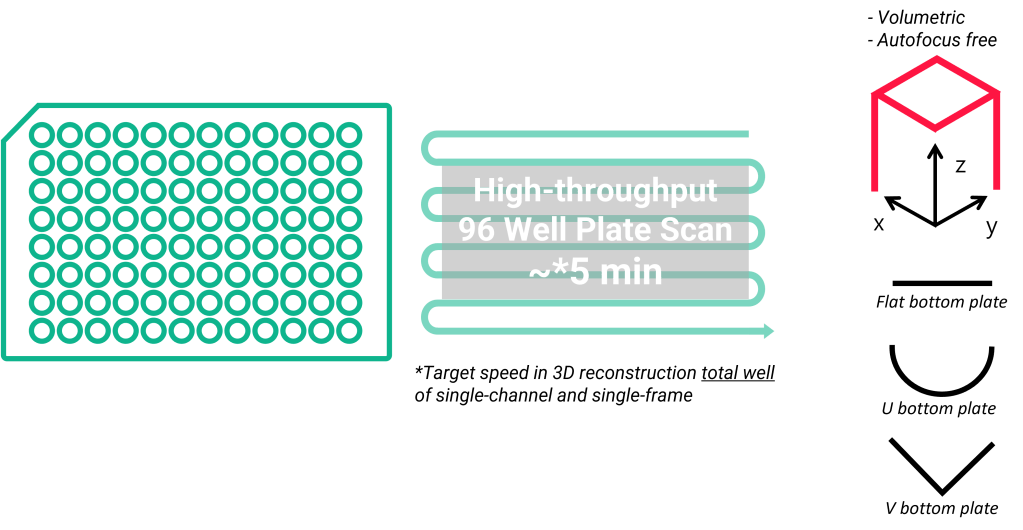
High-throughput in 3D
A Power of Real-time 3D Imaging – It can obtain real-time assay data for 3D mini-organs through 3D imaging without Z-stacking. This allows for multi-well plate-based 3D high-throughput assays at previously impossible time intervals.
- Scanning flat, U-bottom and V-bottom 96 wells in 3D per 9 minutes (current record)
- A 3D data in 2D storage size
- Multi-channel fluorescence for high-content analysis
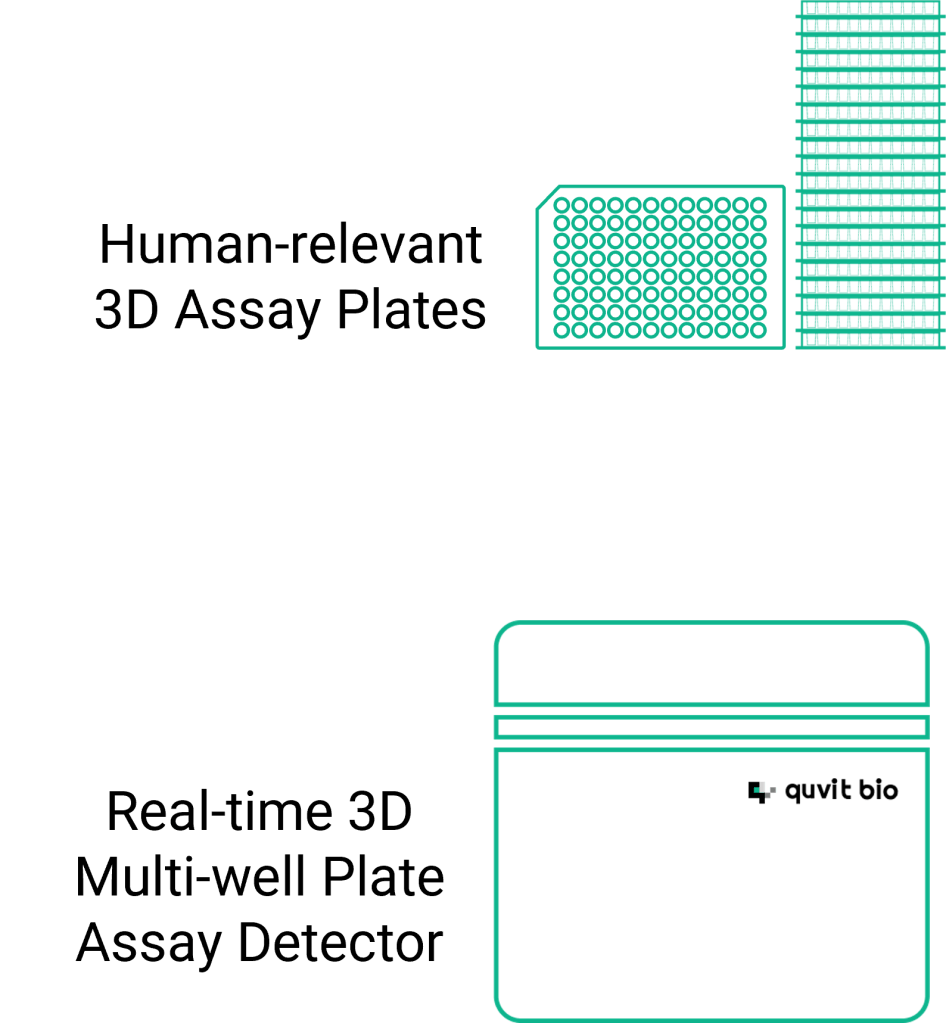
3D Cell-based Assay
By combining human-relevant 3D assay plates with real-time 3D assay detector, QField™,
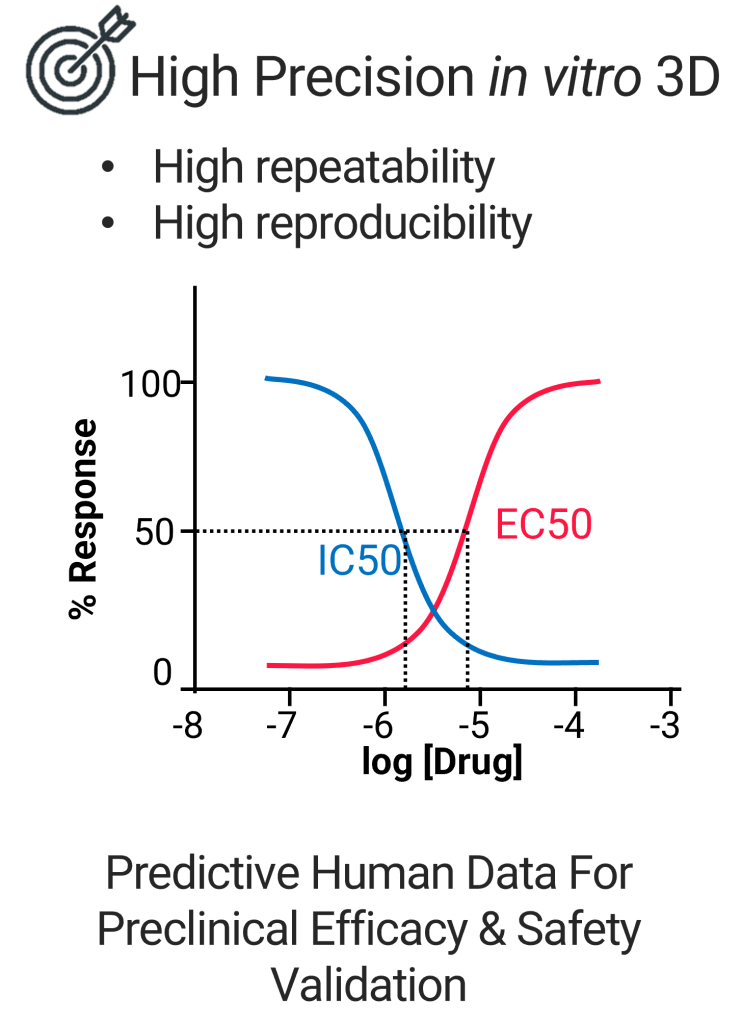
we enable quantitative measurement of biological activity in 3D cell cultures, offering high precision in assessing the potency, safety, and mechanism-of-action (MOA)-specific effectiveness and inhibition of potential therapies in higher throughput manner.
This method leverages predictive, human data-driven models to enhance preclinical efficacy and safety validation, providing a more accurate and reliable assessment of drug candidates
The System Specification
Objective Lens : 10X, NA 0.25
Imaging Channels : Bright Field, 3 Fluorescence Channels
Maximum FPS : 95
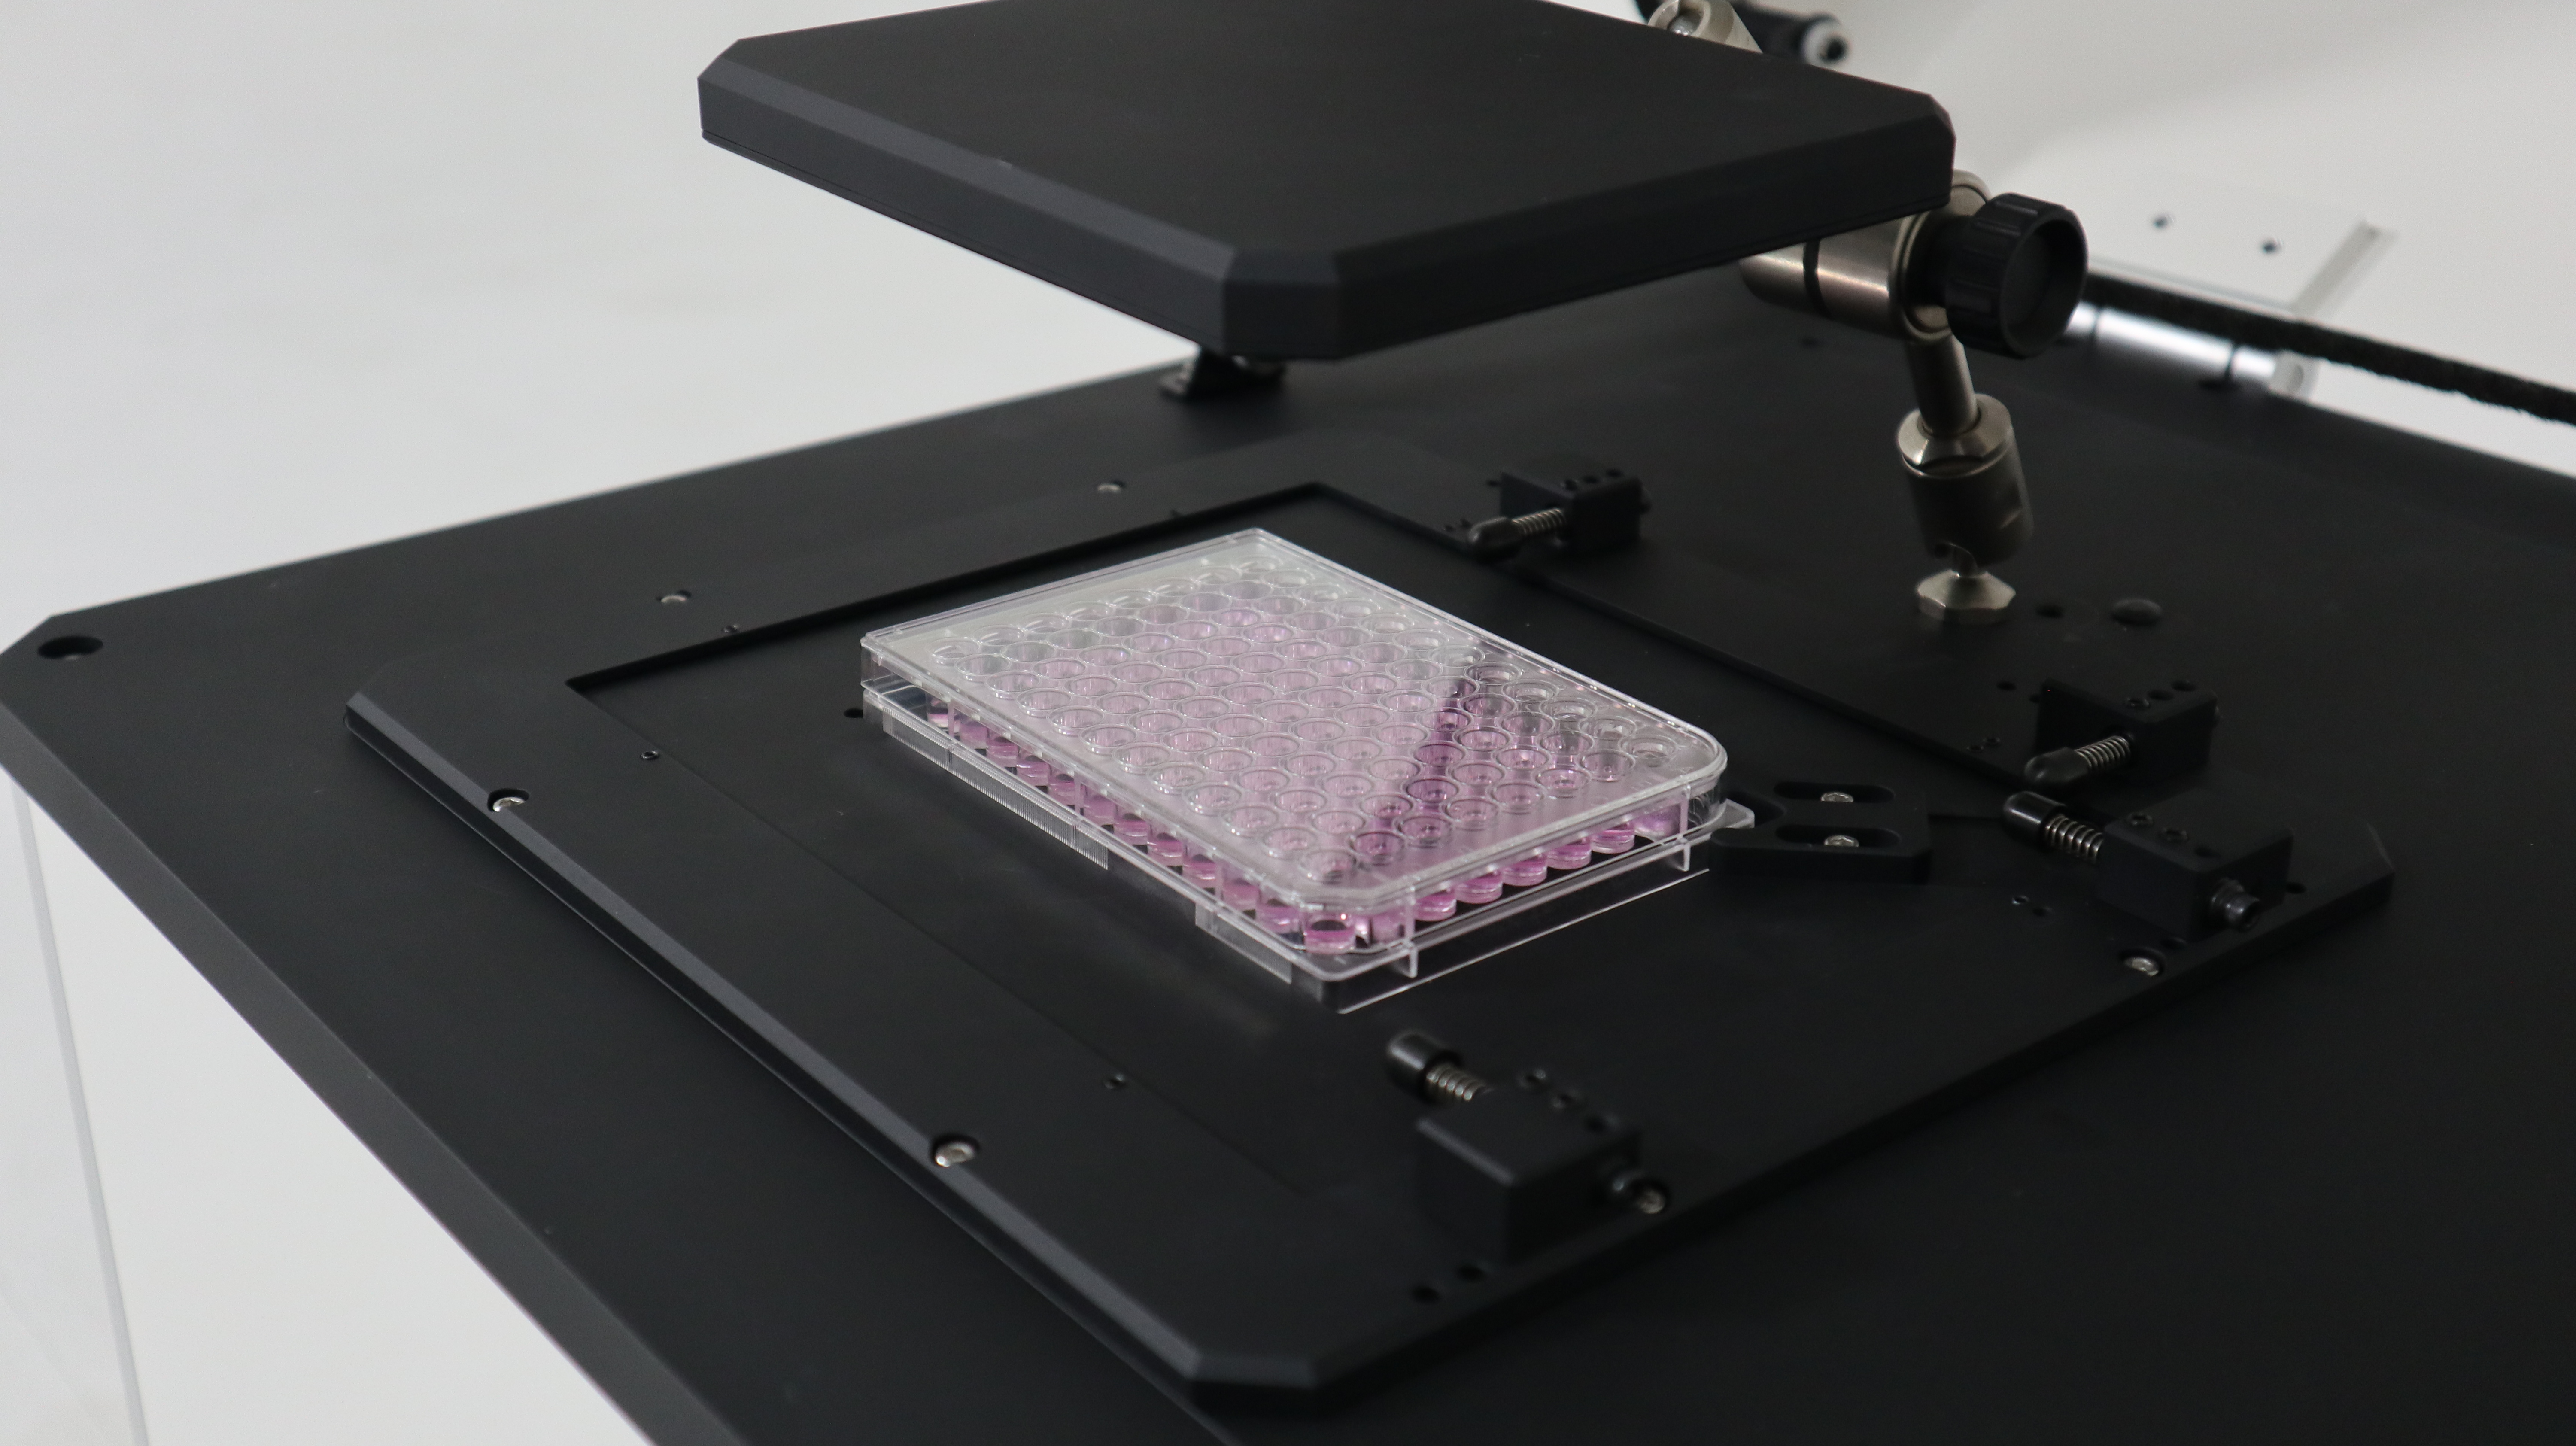
Support Format : Multi-well Plate (Flat, U-bottom, V-bottom, Sub-well)
Incubation : Tokai Hit Stage-Top Incubator (Optional)
CPU : AMD Ryzen Threadripper PRO 3955WX
GPU : NVIDIA RTX A6000
RAM : 128 GB
SSD : 8 TB
QField™ : Characterization
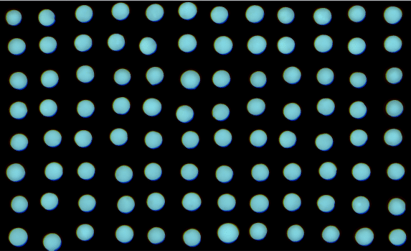
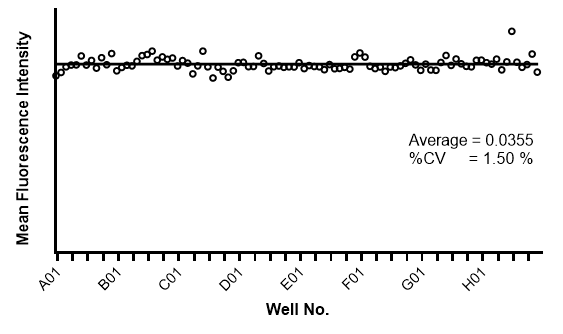
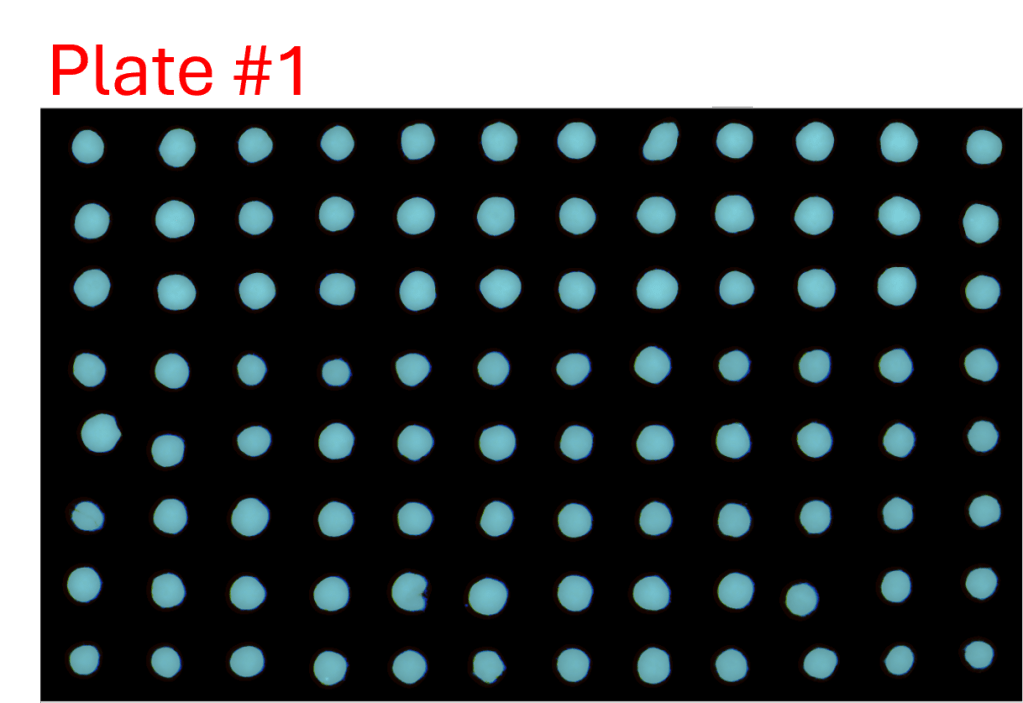
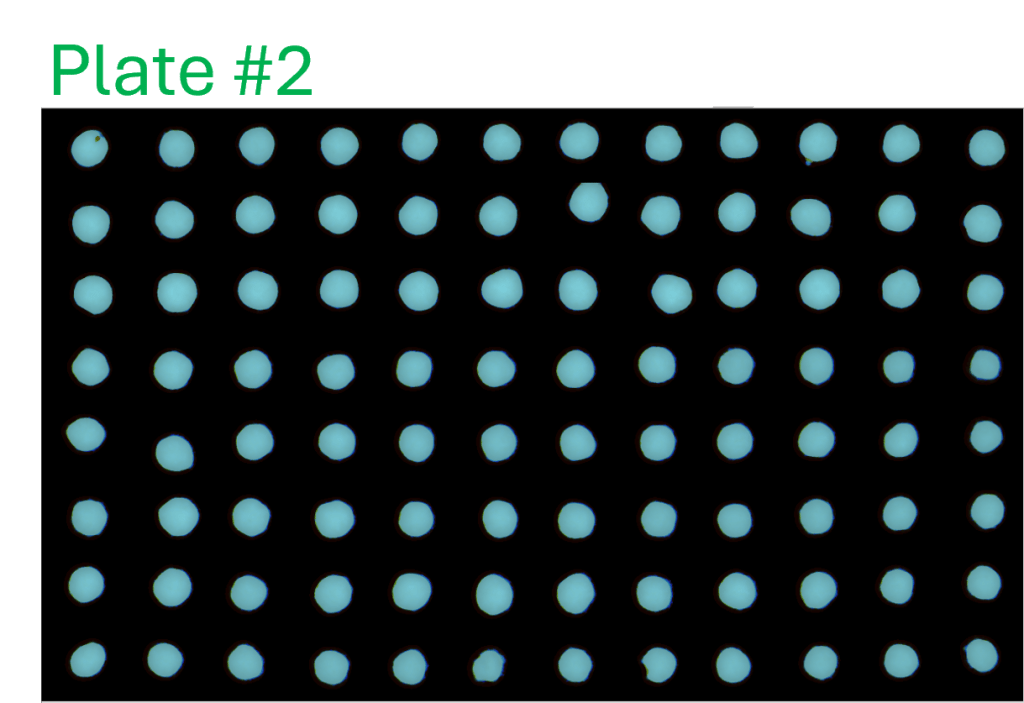
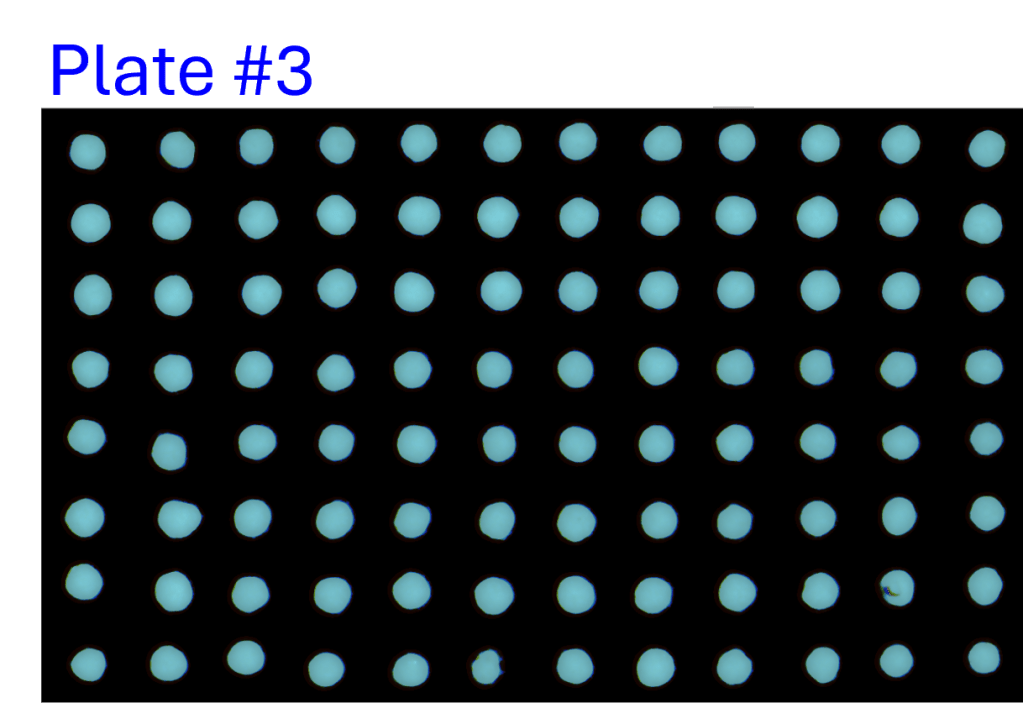
Consistency of scanning 96 multi-well plate
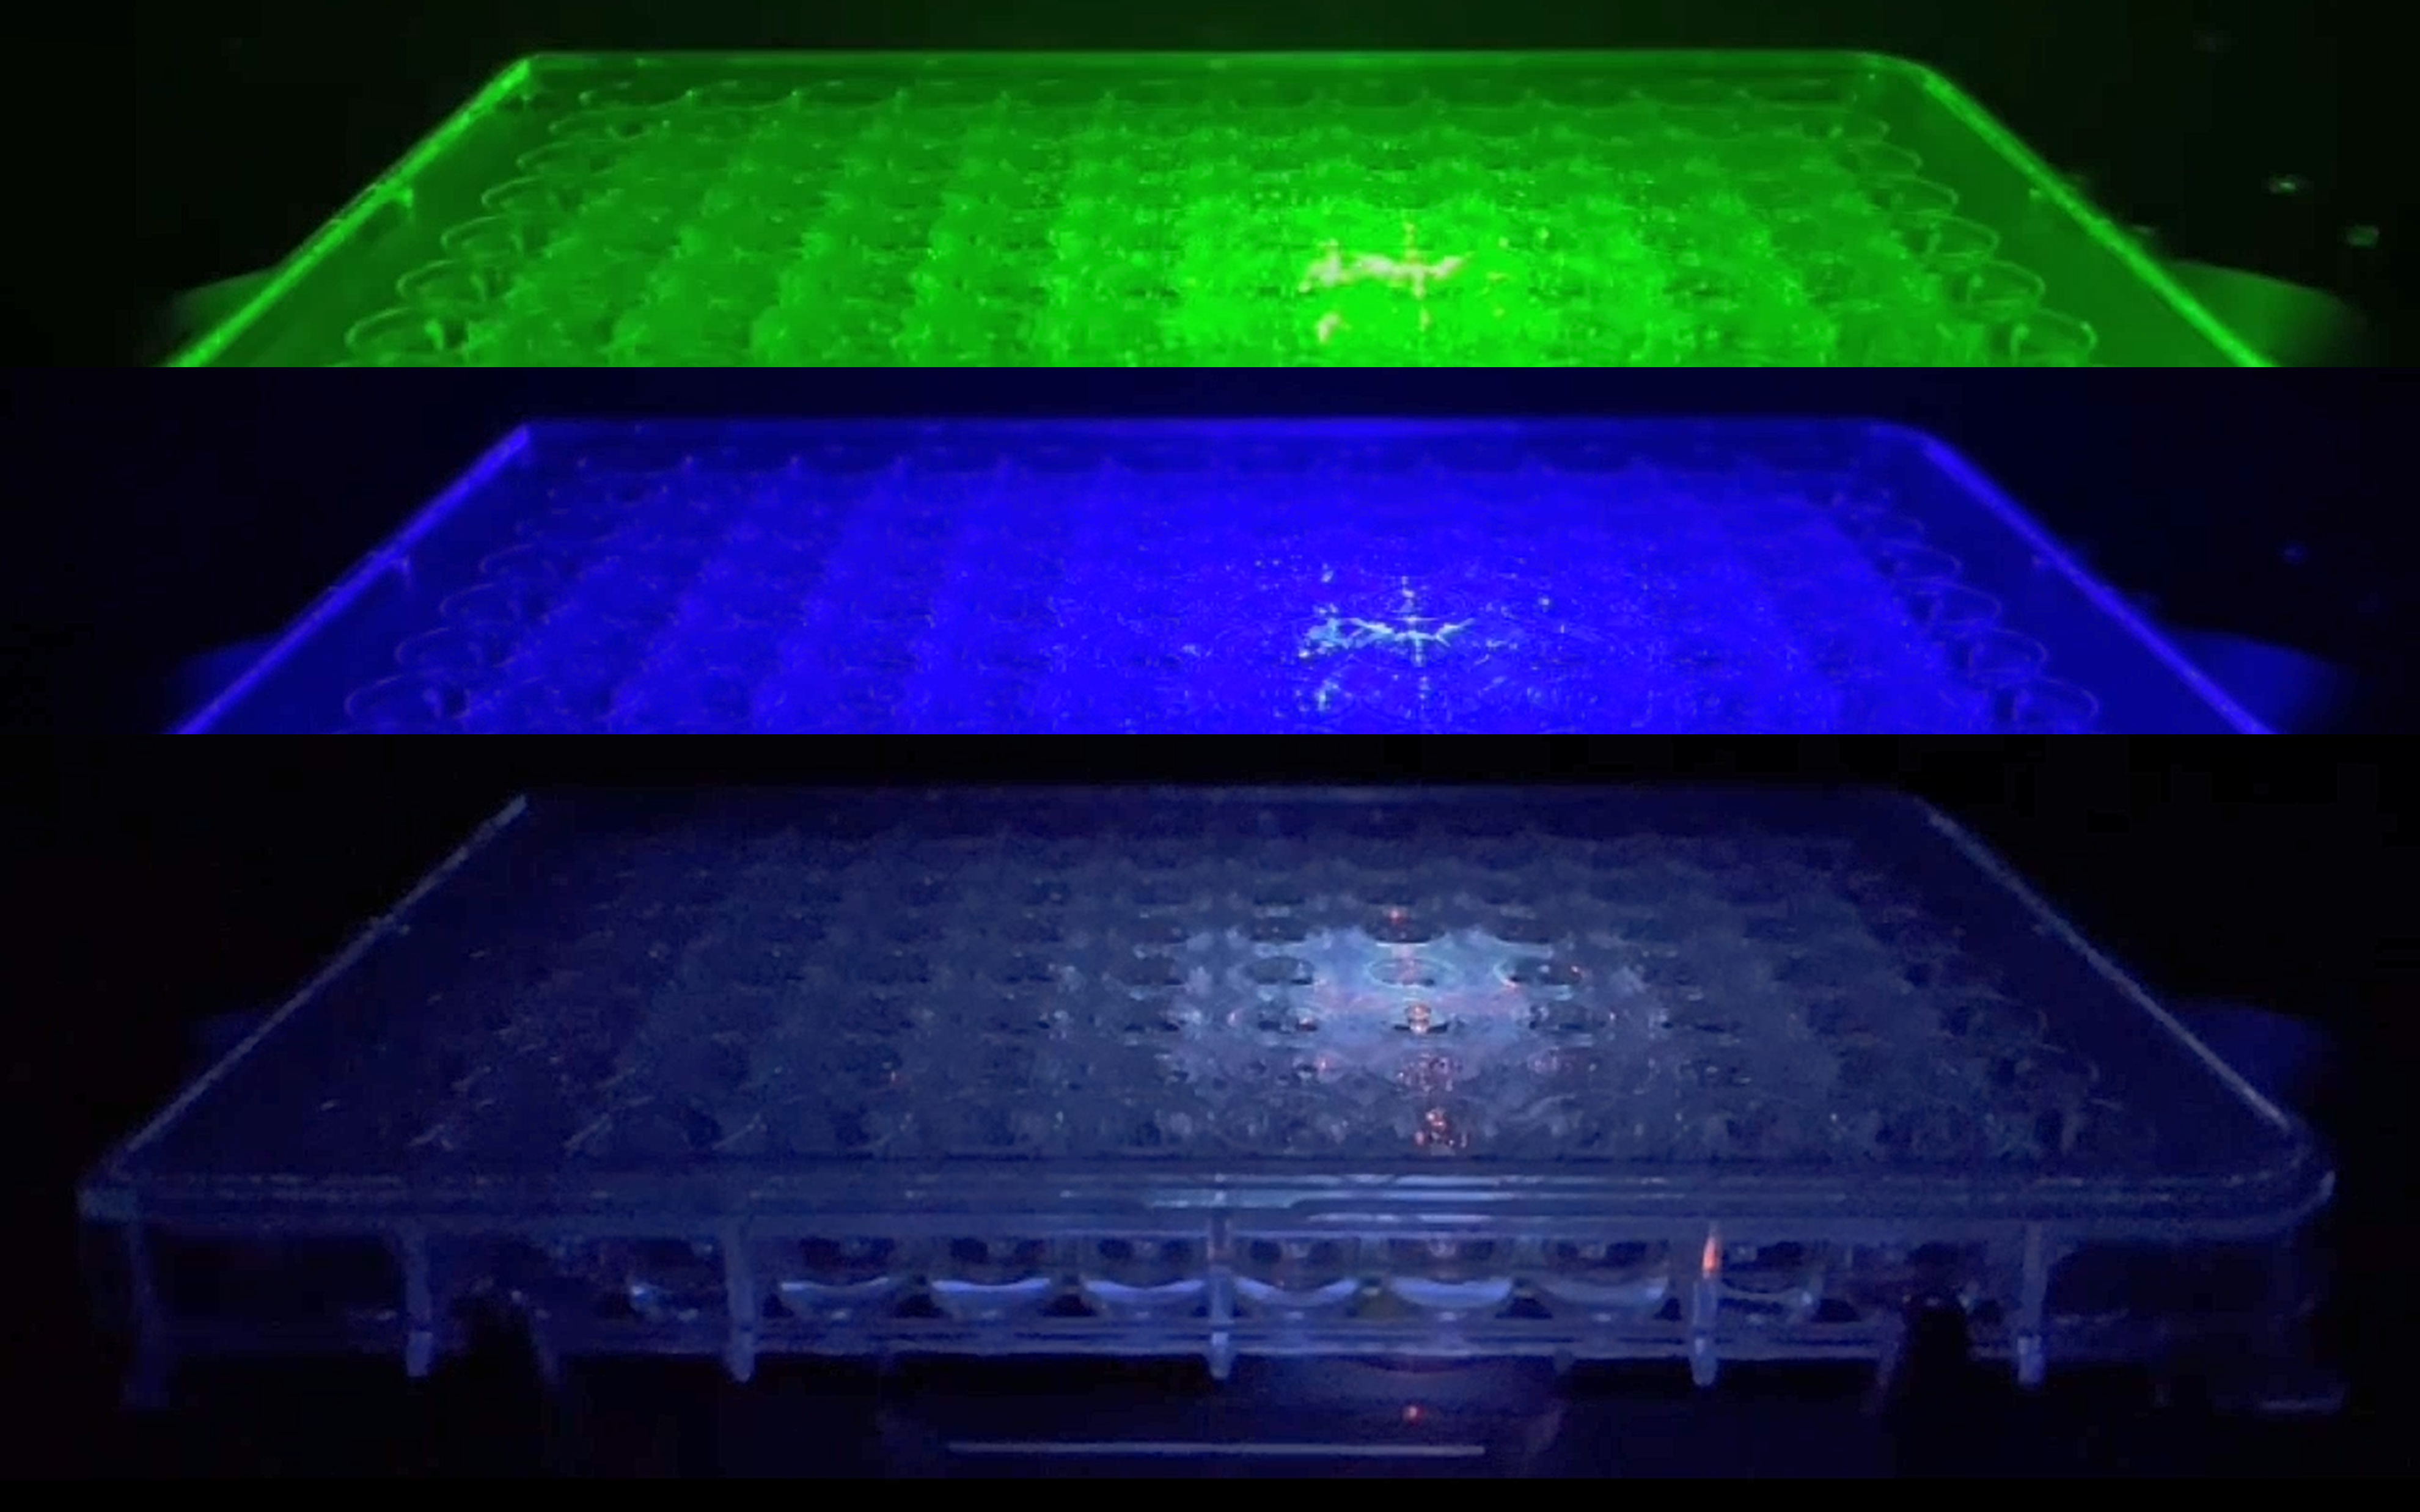
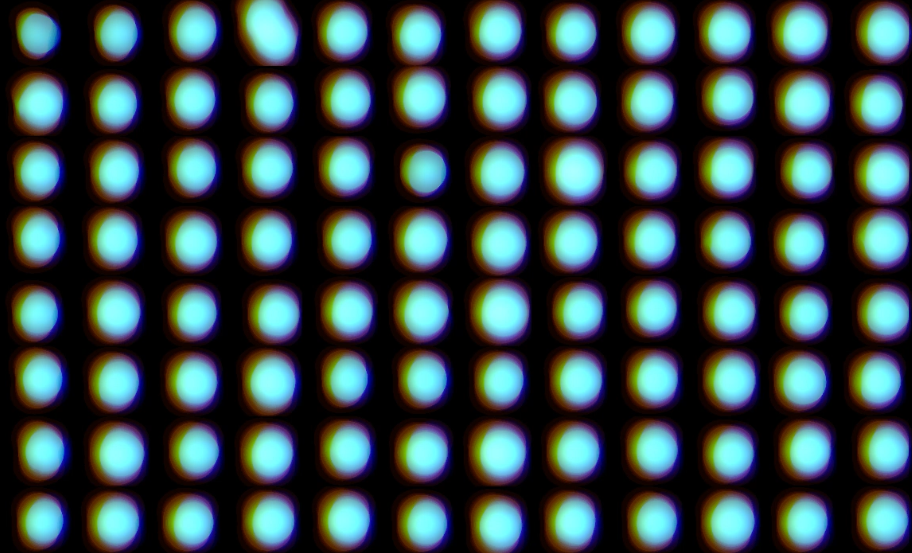
A single-channel, single-frame 3D scan was performed on 96 green-fluorescent beads (425-500 micrometers, Cospheric) placed on V-bottom 96 well plate (S-Bio). The beads are displayed in a 96-well array and color-coded by depth (from bottom to top: blue, green, red). Each scanned 3D image is reconstructed in real-time and processed using maximum intensity Z-projection during scanning, and the mean fluorescent intensity of each well in the entire assay image is calculated and exported to a CSV file with raw images immediately after the scan is completed. The data show a coefficient of variation (CV, σ/μ) of 1.5% for this sample, indicating high consistency.
Linearity of scanning 96 multi-well plate
- A single-channel, single-frame 3D scan was performed on 96 custom-built green-fluorescent hydrogel beads, containing different concentrations of quantum dot nanobeads placed in a V-bottom 96 well plate (S-Bio).
- The beads form a gradient (6 concentrations) and demonstrate consistency under identical conditions in every 2 columns. They are displayed in a 96-well array, color-coded by depth (from bottom to top: blue, green, red).
- Each scanned 3D image is reconstructed in real-time and processed using maximum intensity Z-projection during scanning, and the mean fluorescent intensity of each well in the entire assay image is calculated and exported to a CSV file with raw images immediately after the scan is completed.
- The data show an R-squared value of 0.9794 for this assay, indicating high linearity.

QField™ : Applications
Long-term 3D live monitoring of 3D co-culture model and its targeted molecular response across heterogeneous 3D cellular structure – Immuno-Oncology in vitro assay
- Live-cell imaging was conducted to observe 3D co-cultured spheroids seeded with SKBR3(HER2 positive breast cancer cell) and NHDF(Normal human dermal fibroblast) and interacted with PBMCs(Peripheral blood mononuclear cells) as effector cells, maintaining a 5:1 effector-to-target (E:T) ratio.
- The spheroids were labeled with green fluorescence to detect apoptic cytotoxic activity in 3D(visualized using depth color map image on the right) and red fluorescence for masking(visualized using maximum Z project image on the right), enabling normalized quantification. 3D high-throughput time-course data for a 96-well plate were recorded over 72 hours with 30-minute intervals in a system-integrated stage-top incubation.
- Thanks to the single-shot 3D detection capability of QField™, Quvit Bio’s light-field microscopy (LFM)-based volumetric fluorescence analysis system, non-phototoxicity was ensured live monitoring over extended time through minimized epi-fluorescent illumination power during 3D imaging.
- This advanced approach revealed the anti-HER2 antibody(Trastuzumab)-dependent cellular cytotoxicity (ADCC) enhanced drug response within heterogeneous drug target distributions in the each solid 3D co-culture model
- By comparing the ADCC response to the positive control using the small molecule inhibitor, Staurosporine, the results clearly demonstrated how drug response dynamics can vary significantly over time between non-targeted and emerging targeted drug modalities.
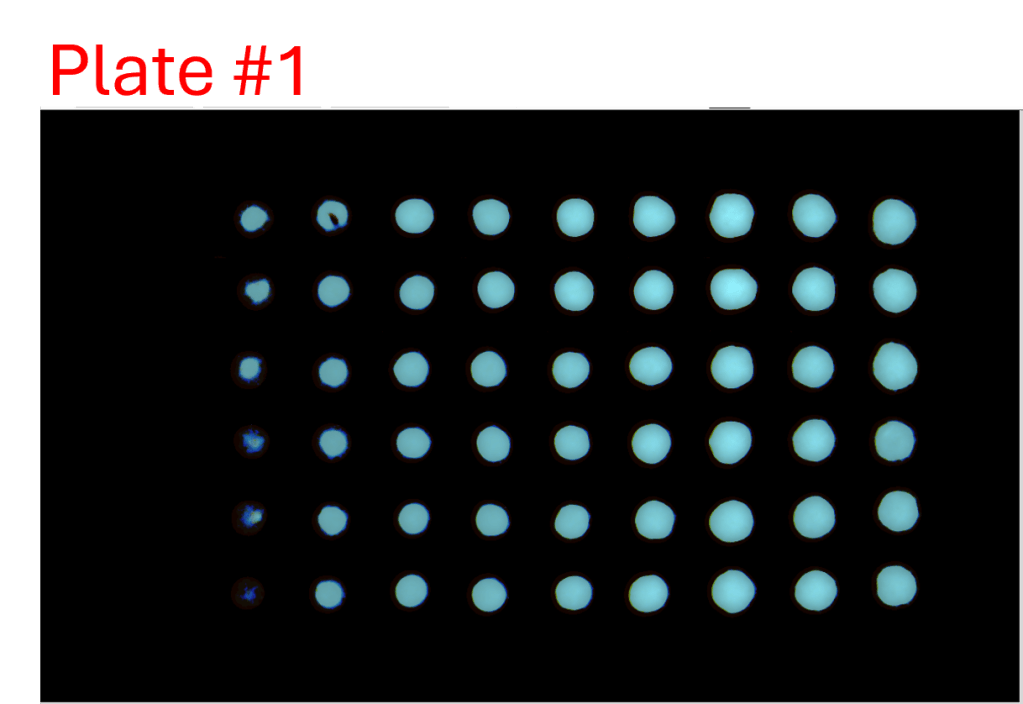
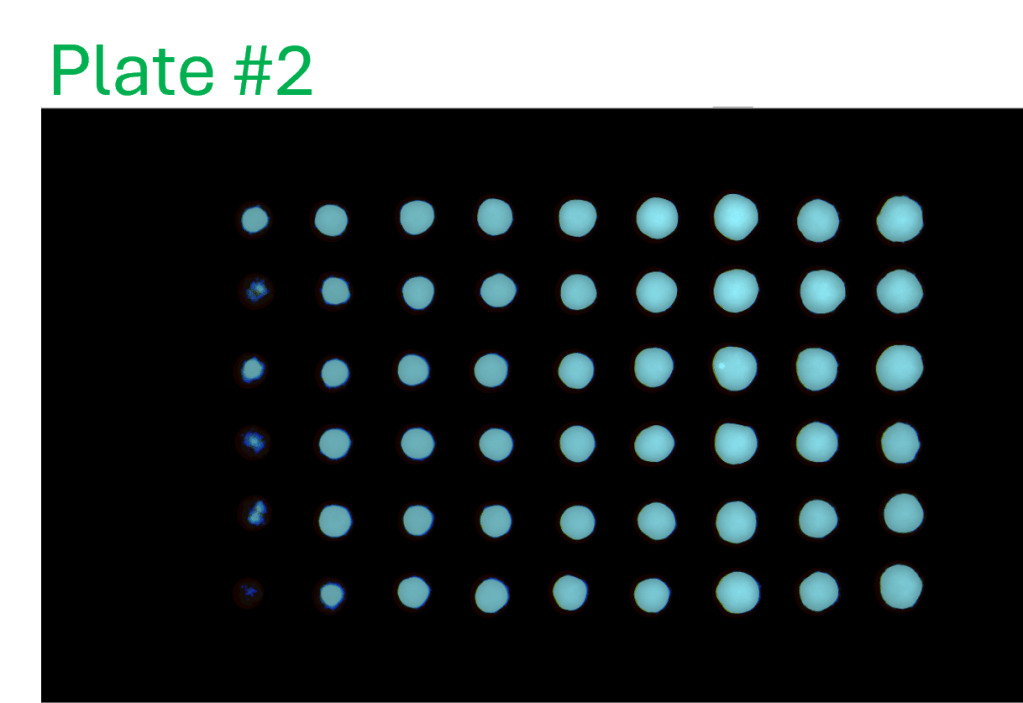
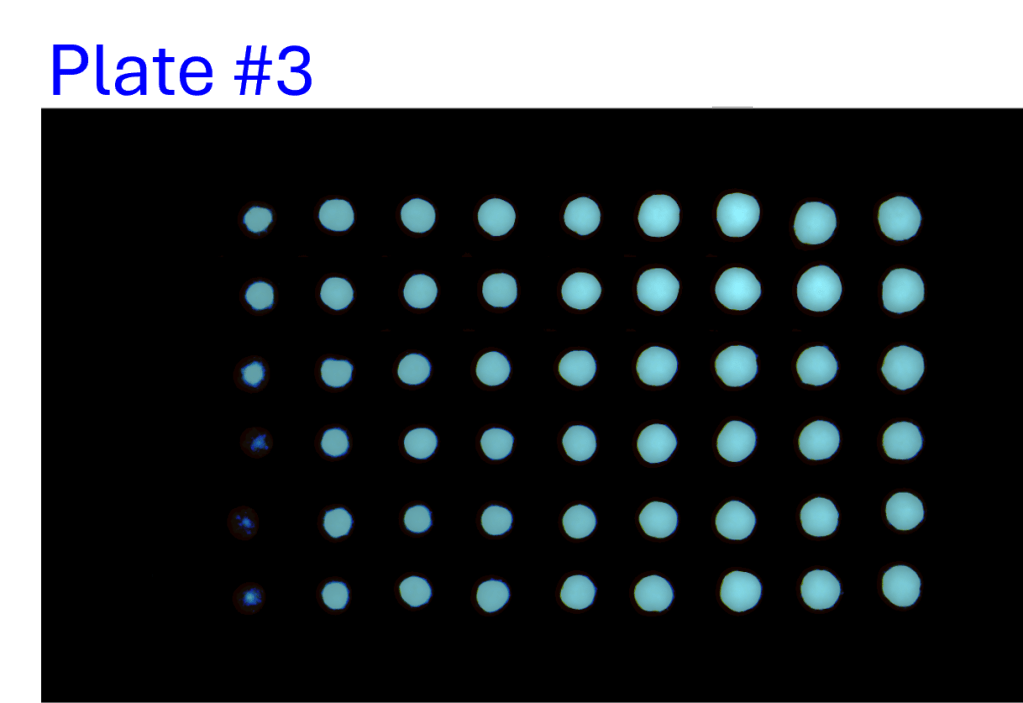
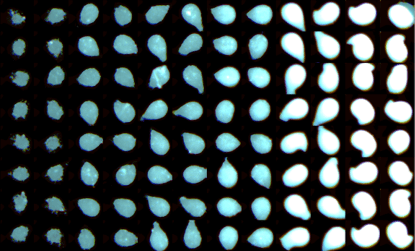
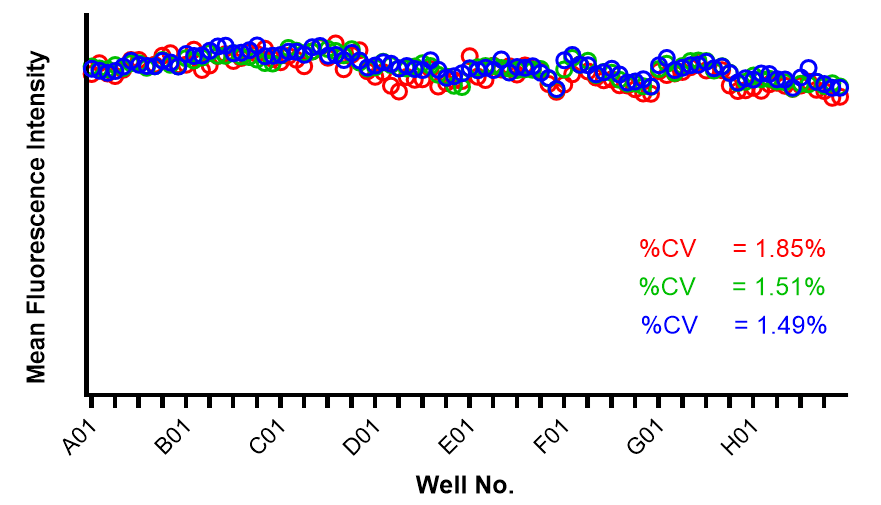
Consistency of intra- and inter-assay
- A single-channel, single-frame 3D scan was performed on A549 spheroids fluorescently labeled with a caspase activity probe and placed in a V-bottom 96 well plate (S-Bio).
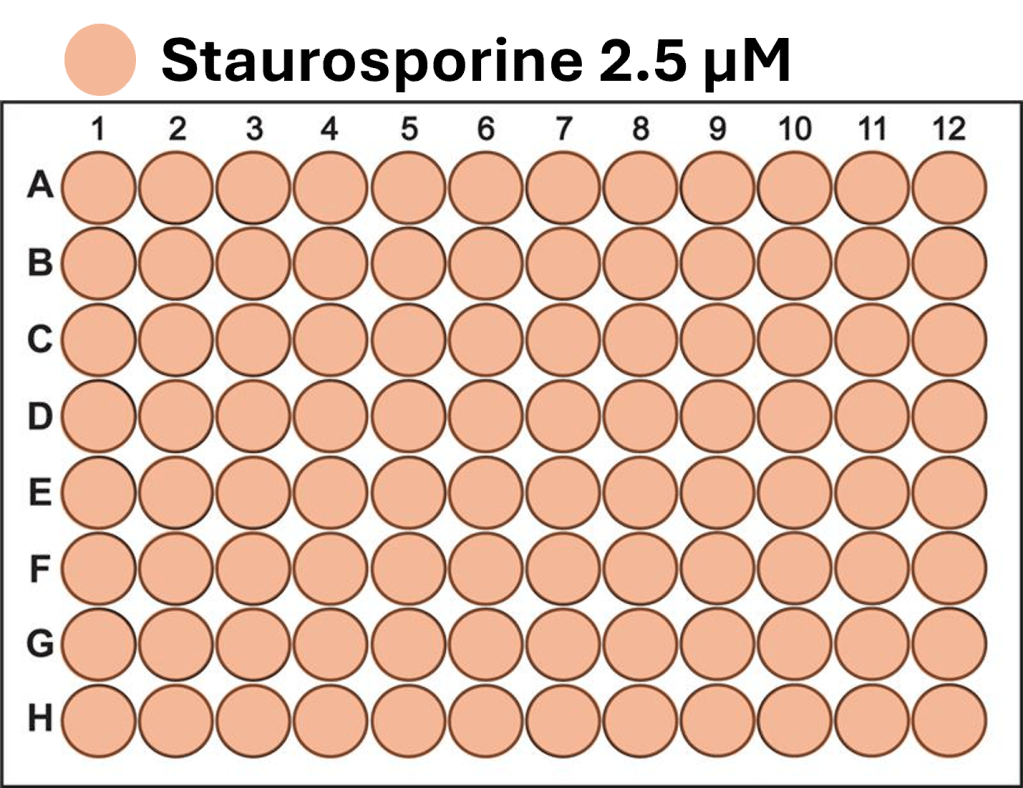
- The spheroids demonstrate consistency under identical conditions of treatment with 2.5 µM Staurosporine, an apoptosis inducer, across all 96 wells. They are displayed in a 96-well array, color-coded by depth (from bottom to top: blue, green, red).
- Each scanned 3D image is reconstructed in real-time and processed using maximum intensity Z-projection during scanning, and the mean fluorescent intensity of each well in the entire assay image is calculated and exported to a CSV file with raw images immediately after the scan is completed.
- The data show a coefficient of variation (CV, σ/μ) below 2% across plate-to-plate triplicates, indicating high inter-assay consistency.
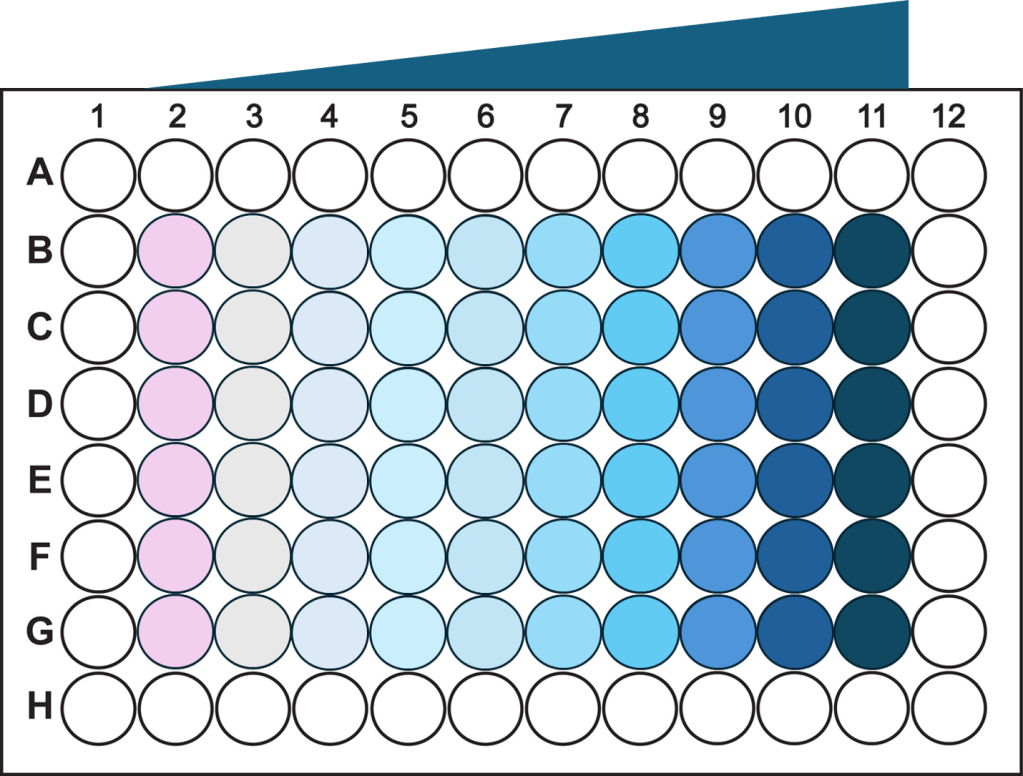
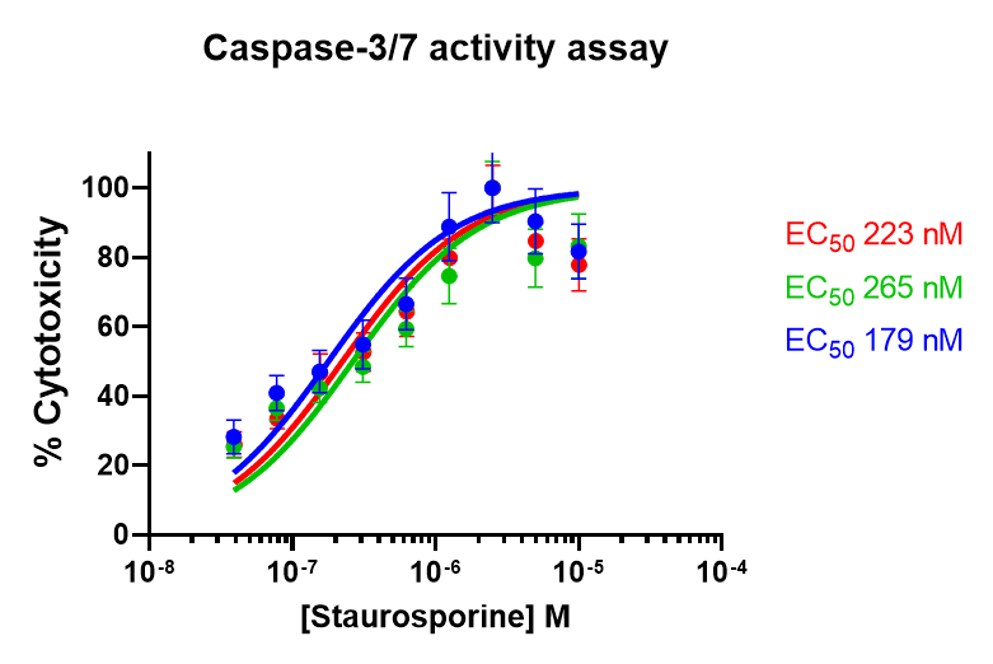
Dose-response curves in triplicates within 30 minutes
- A single-channel, single-frame 3D scan was performed on A549 spheroids fluorescently labeled with a caspase activity probe and placed in a V-bottom 96 well plate (S-Bio) using a manual pipet.
- The spheroids demonstrate dose-responsive drug effectiveness under dose-dependent treatment conditions with a 0.04–10 µM range of Staurosporine, an apoptosis inducer, within inner 60 wells. They are displayed in a 96-well array, color-coded by depth (from bottom to top: blue, green, red).
- Each scanned 3D image is reconstructed in real-time and processed using maximum intensity Z-projection during scanning, and the mean fluorescent intensity of each well in the entire assay image is calculated and exported to a CSV file with raw images immediately after the scan is completed. <7 minutes were taken for each assay.
- The data show a coefficient of variation (CV, σ/μ) of 15% across plate-to-plate triplicates for the EC50 value, indicating high inter-assay robustness for the 3D cell-based assay with an acceptance criterion often up to 25%.